ROAS คืออะไร — คำนวณ ROAS, CPA, CPL ยังไงให้ถูกต้อง พร้อม Calculator 2026
roas คืออะไร — รวมสูตรคำนวณ ROAS, CPA, CPL พร้อมตัวอย่างจริง, benchmark by industry และ Marketing Calculator ที่ใช้ตัดสินใจ budget ได้ทันที

ROAS คืออะไร — คำนวณ ROAS, CPA, CPL ยังไงให้ถูกต้อง พร้อม Calculator 2026
Last updated: 2026-05-28
Key Takeaways: roas คืออะไร — ROAS (Return on Ad Spend) คือ revenue ÷ ad spend ใช้วัดว่า ad ทุก 1 บาทสร้างยอดขายกี่บาท แตกต่างจาก CPA (Cost per Acquisition — ต้นทุนต่อการได้ลูกค้า 1 ราย) และ CPL (Cost per Lead — ต้นทุนต่อ lead 1 ราย) ที่เหมาะกับธุรกิจคนละแบบ B2C / e-commerce ใช้ ROAS เป็นหลัก เพราะมี revenue ทันที, B2B ที่ sales cycle ยาวใช้ CPL + CPA เป็นหลัก benchmark ROAS ที่ healthy = 3-5x สำหรับ B2C, 5-10x สำหรับ marketplace, และ 2-4x สำหรับ B2B ที่นับ pipeline value ที่ปิดได้จริง
ในการ run ads สิ่งที่แยก performance marketer ที่เก่งกับมือใหม่ไม่ใช่ “เลือก channel ไหน” — แต่คือ เข้าใจตัวเลขจริงหลัง campaign
หลายธุรกิจไทยรัน Meta Ads, Google Ads, Marketplace Ads ทุกเดือนแต่ตอบไม่ได้ว่า:
– ROAS เท่าไหร่ถึงเรียกว่า healthy?
– CPA สูงเกินไปไหม?
– ควรเพิ่มหรือลด budget?
ปัญหาคือ คำนวณตัวเลขไม่ครบ — บางทีลืม cost factor, บางทีไม่นับ LTV, บางทีเปรียบเทียบกับ benchmark ผิด industry
บทความนี้อธิบาย ROAS, CPA, CPL อย่างละเอียด — สูตรคำนวณ, benchmark by industry, ตัวอย่างจริง และ template calculator ที่ใช้ตัดสินใจ budget ได้ทันที
roas คืออะไร — Definition + สูตร
ROAS ย่อมาจาก Return on Ad Spend — อัตราส่วนที่แสดงว่า ad spend ทุก 1 บาท สร้าง revenue กี่บาท
สูตร ROAS
ROAS = Revenue from Ads ÷ Ad Spend
ตัวอย่าง:
– Ad spend ใน Meta Ads: ฿50,000/เดือน
– Revenue from ads (track ผ่าน CAPI): ฿250,000/เดือน
– ROAS = 250,000 ÷ 50,000 = 5x
หมายความว่า ทุก 1 บาทที่ลงโฆษณา ได้ revenue กลับมา 5 บาท
ROAS เขียนแบบไหนได้บ้าง
- 5:1 หรือ 5x หรือ 500% — ทั้งสามแบบหมายถึงเดียวกัน
- ใน Google/Meta Ads Manager แสดงเป็น ratio (5.00) หรือ percent (500%)
ROAS ดีหรือไม่ดี — ขึ้นกับ Margin
ROAS 5x ดูดี แต่จริงๆ ดี/ไม่ดี ขึ้นกับ gross margin ของธุรกิจ
Break-even ROAS
Break-even ROAS = 1 ÷ Gross Margin %
ตัวอย่าง:
| Business | Margin | Break-even ROAS |
|—|—|—|
| E-commerce fashion | 50% | 2.0x |
| B2B SaaS | 80% | 1.25x |
| Marketplace seller | 25% | 4.0x |
| Affiliate | 15% | 6.67x |
Insight: Marketplace seller margin 25% → ROAS ต้องอย่างน้อย 4x ถึงจะ break-even ROAS 3x = ขาดทุน แม้ดูเหมือนกำไร
Target ROAS (สำหรับ profit ไม่ใช่ break-even)
ปกติ target ROAS = break-even ROAS × 1.5-2.0 เพื่อ cover:
– Operating cost (ค่าจัดการ, ค่าจัดส่ง, สูญหาย)
– Profit margin จริง
ตัวอย่าง: marketplace seller margin 25%, break-even 4x → target 6-8x
CPA คืออะไร — Cost per Acquisition
CPA (Cost per Acquisition) = ต้นทุนเฉลี่ยในการได้ ลูกค้า 1 ราย
สูตร CPA
CPA = Total Ad Spend ÷ Number of Customers Acquired
ตัวอย่าง:
– Ad spend: ฿50,000
– Customers ที่ปิดได้: 100 คน
– CPA = 50,000 ÷ 100 = ฿500
CPA ดีหรือไม่ดี — ขึ้นกับ LTV
CPA ที่ healthy = LTV ÷ 3 (กฎ Customer-Acquisition Cost rule ของ B2B SaaS)
| Business | LTV | Target CPA |
|---|---|---|
| E-commerce ที่ AOV ฿800, repeat 30% | ~฿2,400 | ≤ ฿800 |
| B2B SaaS (24-month retention) | ~฿30,000 | ≤ ฿10,000 |
| Marketplace seller AOV ฿1,500 | ~฿4,500 | ≤ ฿1,500 |
| One-time purchase (course, event) | = price | ≤ price × 30% |
Insight: CPA สูงไม่ใช่ปัญหา ถ้า LTV สูงพอ — บริษัท B2B ที่ปิดดีล 1 ล้านต่อปี ยอม CPA ฿50,000 ได้
CPL คืออะไร — Cost per Lead
CPL (Cost per Lead) = ต้นทุนเฉลี่ยในการได้ lead 1 ราย (ที่ยังไม่ปิด)
สูตร CPL
CPL = Total Ad Spend ÷ Number of Leads
ตัวอย่าง:
– Ad spend: ฿50,000
– Lead (download whitepaper, fill form): 250 คน
– CPL = 50,000 ÷ 250 = ฿200
CPL → CPA Conversion
ไม่ใช่ทุก lead ปิดได้ — ต้องคำนวณผ่าน lead-to-customer conversion rate:
CPA = CPL ÷ Lead-to-Customer Conversion Rate
ตัวอย่าง:
– CPL: ฿200
– Conversion rate (lead → customer): 10%
– CPA = 200 ÷ 0.10 = ฿2,000
CPL เหมาะกับธุรกิจแบบไหน
- ✅ B2B — sales cycle ยาว ต้อง nurture ก่อนปิด
- ✅ High-ticket consulting / agency — ลูกค้าต้องคุยก่อนตัดสินใจ
- ✅ Real estate / luxury goods
- ❌ E-commerce ทั่วไป — ไม่มี “lead” stage ปกติ
- ❌ Marketplace — purchase ทันที
เลือก Metric ไหน — Decision Framework
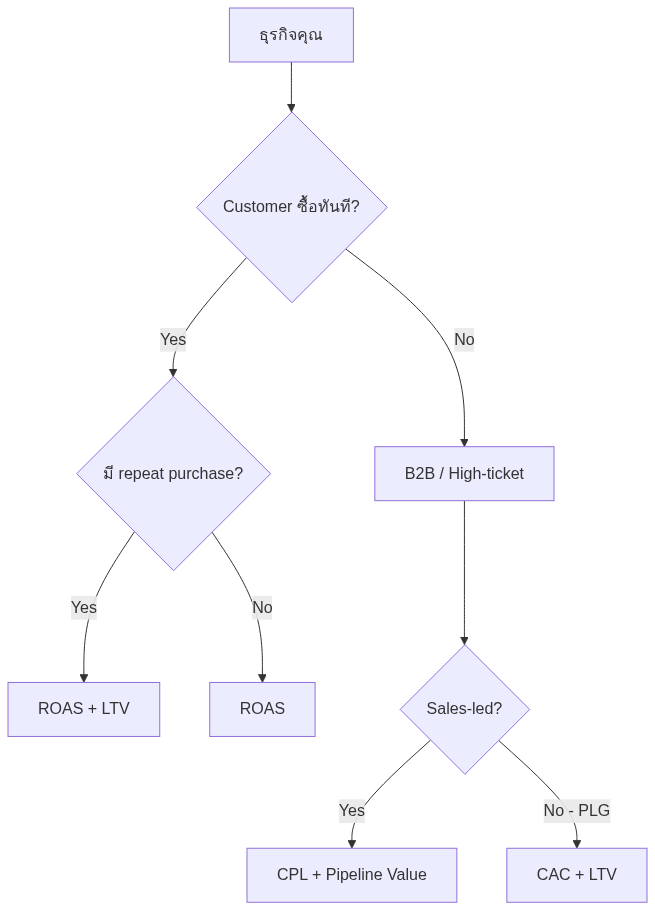
| Business Type | Primary Metric | Secondary |
|---|---|---|
| E-commerce / D2C | ROAS | LTV, AOV |
| Marketplace seller | ROAS | Margin, Stock |
| B2B SaaS (PLG) | CAC | LTV, MRR |
| B2B sales-led | CPL → CPA | Pipeline value, Win rate |
| High-ticket B2C (course, coaching) | CPA | LTV per cohort |
| Real estate / Auto | CPL | Cost per appointment |
Benchmark by Industry (ไทย 2026)
จาก data ที่ทีม Adsitec รวบรวมจากลูกค้า B2B + B2C ในไทย ปี 2024-2025:
ROAS Benchmark
| Industry | ROAS Healthy | Top Performer |
|---|---|---|
| E-commerce fashion | 3-5x | 7-10x |
| E-commerce skincare | 4-7x | 8-12x |
| Marketplace (Shopee/Lazada) | 5-8x | 10-15x |
| B2B services | 2-4x | 5-8x |
| B2B SaaS | 1.5-3x | 4-6x |
| Real estate | 3-5x | 6-10x |
| Restaurant / Food delivery | 4-6x | 7-9x |
CPL Benchmark
| Industry | CPL Healthy | High-quality lead |
|---|---|---|
| B2B SaaS | ฿300-800 | ฿200-500 |
| B2B services (consulting, agency) | ฿500-1,500 | ฿300-800 |
| Real estate (low-mid) | ฿200-500 | ฿150-300 |
| Real estate (luxury) | ฿1,000-3,000 | ฿800-1,500 |
| Insurance / Financial | ฿200-600 | ฿100-300 |
| Health / Aesthetic | ฿150-400 | ฿100-250 |
CPA Benchmark
| Industry | CPA Healthy |
|---|---|
| E-commerce ทั่วไป | ฿200-500 |
| B2B SaaS | ฿3,000-15,000 |
| B2B services (deal ฿100K+) | ฿10,000-50,000 |
| High-ticket course | ฿500-2,000 |
| Beauty clinic | ฿800-3,000 |
Marketing Calculator — ตัวอย่างใช้งาน
Scenario 1: E-commerce skincare
Input:
– Ad spend: ฿100,000/เดือน
– Revenue from ads: ฿420,000
– Customers acquired: 380
– AOV: ฿1,105
– Repeat rate: 35%
Calculations:
– ROAS = 420,000 ÷ 100,000 = 4.2x ✅ healthy
– CPA = 100,000 ÷ 380 = ฿263 ✅ healthy
– LTV = AOV × (1 + repeat rate × avg repeat purchases)
– = 1,105 × (1 + 0.35 × 2.5) = ฿2,072
– LTV:CAC ratio = 2,072 / 263 = 7.9x ✅ excellent
Decision: เพิ่ม budget ได้ — ROAS ดี, LTV:CAC > 3x
Scenario 2: B2B SaaS
Input:
– Ad spend: ฿200,000/เดือน
– Leads: 800
– Leads → customer conversion: 8%
– Customers: 64
– ARR per customer: ฿24,000
Calculations:
– CPL = 200,000 ÷ 800 = ฿250 ✅ healthy
– CPA = 250 ÷ 0.08 = ฿3,125 ✅ healthy
– LTV (24-month retention) = 24,000 × 2 = ฿48,000
– LTV:CAC = 48,000 / 3,125 = 15.4x ✅ excellent
Decision: scale aggressive ได้ — มี runway ขยายมาก
Scenario 3: Marketplace seller (Shopee)
Input:
– Ad spend: ฿80,000/เดือน
– Revenue from Shopee Ads: ฿320,000
– Gross margin: 22%
Calculations:
– ROAS = 320,000 ÷ 80,000 = 4.0x
– Break-even ROAS = 1 / 0.22 = 4.55x
– Gross profit = 320,000 × 0.22 = ฿70,400
– Net (after ad) = 70,400 – 80,000 = -฿9,600 ⚠️ ขาดทุน!
Decision: ROAS 4x ไม่พอ — ต้อง:
– เพิ่ม AOV (bundle, cross-sell) → ลด margin compress
– หรือลด ad bid → ROAS ต้องถึง 5x+
– หรือ negotiate ต้นทุนสินค้าให้ margin > 25%
Common Mistakes ของการคำนวณ
1. นับ revenue ไม่ครบ — ลืม attribution window
- Meta default 7-day click + 1-day view
- Google default 30-day
- ผลที่ track ใน platform = lower bound เสมอ — มี long-tail conversion ที่ไม่ attribute
ทางออก: วัด total revenue / total ad spend (top-down) เปรียบเทียบกับ platform-reported (bottom-up)
2. นับ ad spend ไม่ครบ
- ลืม creative production cost
- ลืม agency fee
- ลืม MarTech tool subscription
ทางออก: ใช้ Customer Acquisition Cost (Total) ที่รวมทุก marketing cost ÷ customers:
CAC (total) = (Ad spend + Creative + Agency fee + Tool subscription) ÷ Customers
3. ใช้ AOV แทน LTV
- AOV = first purchase value
- LTV = total value across customer lifetime
- ธุรกิจที่มี repeat = LTV >> AOV
ทางออก: compute LTV จริงจาก cohort data — ไม่ใช่ estimate จาก AOV เฉยๆ
4. เปรียบเทียบกับ benchmark ผิด industry
- ROAS 5x = excellent for marketplace
- ROAS 5x = average for skincare
- ROAS 5x = great for B2B SaaS
ทางออก: ใช้ benchmark จาก industry เดียวกัน + size ใกล้เคียง
5. ตัดสินใจจาก week-by-week data
- Marketing data volatility สูงในช่วงสั้น
- เช่น 1 สัปดาห์ ROAS ตก 30% อาจเป็น seasonal noise
ทางออก: ใช้ 30-day rolling average + เปรียบเทียบกับ same period ปีที่แล้ว
Action Plan — ทำให้ Calculator เป็น Workflow
Daily:
– เช็ค ROAS / CPL ของ campaign สำคัญ — alert ถ้าผิด > 20% จาก baseline
Weekly:
– Review 7-day trend
– ตัด keyword / ad set ที่ ROAS < break-even นาน 14 วัน
Monthly:
– Full calculator run — ROAS, CPA, CPL, LTV
– เปรียบเทียบกับ benchmark + target
– Adjust budget allocation
Quarterly:
– Recompute LTV จาก cohort จริง
– Re-validate target ROAS / CPA จาก margin ปัจจุบัน
– Review attribution model (ดู Attribution Model B2B Guide)
Calculator Template — Spreadsheet Setup
แนะนำสร้าง Google Sheet ที่ link กับ GA4 / Ads Manager:
| ช่อง | สูตร |
|---|---|
| A. Ad Spend | manual input หรือ link ผ่าน GA4 |
| B. Revenue from ads | link ผ่าน GA4 conversion |
| C. Customers acquired | GA4 / CRM |
| D. AOV | = B / C |
| E. Repeat rate | จาก CRM (90-day window) |
| F. LTV estimate | = D × (1 + E × 2.5) |
| ROAS | = B / A |
| CPA | = A / C |
| LTV:CAC | = F / (A/C) |
| Profit (ROAS×margin – 1) × A | based on gross margin |
สรุป
roas คืออะไร, CPA, CPL — ทั้ง 3 ตัวคือ ภาษาพื้นฐาน ของ marketer ที่จะคุยกับ CFO / business owner ได้
หลักการสำคัญ:
– ROAS เหมาะ e-commerce + marketplace ที่มี revenue ทันที
– CPL → CPA เหมาะ B2B + high-ticket ที่ sales cycle ยาว
– Break-even ROAS = 1 / margin — ต่ำกว่านี้ = ขาดทุน
– LTV:CAC > 3x = healthy growth
– เปรียบเทียบ benchmark ใน industry เดียวกัน เท่านั้น
อ่านเพิ่มเติม:
– Google Ads Complete Guide สำหรับ B2B ไทย — pillar guide ของ Google Ads
– Meta Ads B2B: Lead Form vs Landing Page — เลือก format ที่ ROAS ดีกว่า
– Attribution Model B2B — วัดผลข้าม channel ยังไง
ถ้าอยากให้ทีม Adsitec ช่วย setup calculator + dashboard สำหรับธุรกิจของคุณ — นัดคุย 30 นาที