Attribution Model 7 แบบ — เลือกอันไหนเหมาะกับธุรกิจคุณ ปี 2026
attribution model คือ rules ที่กำหนดว่า credit ของ conversion ไปให้ touchpoint ไหน — เปรียบเทียบ 7 model: First-touch, Last-click, Linear, Time-decay, U-shaped, Data-driven, Markov พร้อม use case + tools

Attribution Model 7 แบบ — เลือกอันไหนเหมาะกับธุรกิจคุณ ปี 2026
Last updated: 2026-05-30
Key Takeaways: attribution model คือชุดของกฎที่กำหนดว่า credit ของ conversion จะกระจายให้ touchpoint ไหนในเส้นทาง customer journey 7 model หลัก: First-touch (ทุก credit ให้ first touch), Last-click (ให้ last click), Last non-direct click (default ของ GA4 เก่า), Linear (เท่าๆ กัน), Time-decay (touchpoint ใกล้ conversion ได้ credit มากกว่า), U-shaped/Position-based (40-20-40), Data-driven (algorithm กระจาย) สำหรับ B2B Thai สมัยใหม่ — Data-driven ดีที่สุดถ้ามี volume พอ (≥ 300 conversion/เดือน), Time-decay หรือ U-shaped เป็น fallback ที่ดี First-touch + Last-click ให้ใช้เป็น “sanity check” ไม่ใช่ primary
ในการ run multi-channel marketing ทุก B2B เจอคำถามนี้: “deal ที่ปิดได้ — credit เป็นของ Meta, Google, LinkedIn, organic หรือ direct?”
ลูกค้าคนหนึ่งอาจเห็น LinkedIn post → search Google ของ brand → click ads → 2 สัปดาห์หลัง direct visit แล้ว book demo → ปิด deal ใน 3 เดือน
ถ้าใช้ Last-click = direct ได้ credit 100% ⇒ ตัด LinkedIn + Google ads ออก = ผิดมาก
ถ้าใช้ First-touch = LinkedIn ได้ credit 100% ⇒ พ่าย Google ads + direct ที่ช่วยปิด deal = ผิดอีก
ทางออกคือเข้าใจ attribution model 7 แบบ + เลือกอันที่ฟิตกับ business model
บทความนี้อธิบาย attribution model คือ อะไร, 7 model หลัก, ตัวอย่างคำนวณจริง, และ recommendation สำหรับ B2B ไทย
attribution model คือ อะไร — Definition
attribution model คือชุดกฎ (rules) ที่กำหนดว่า credit ของ conversion จะถูกกระจายให้ marketing touchpoint แต่ละจุดในเส้นทาง customer journey อย่างไร
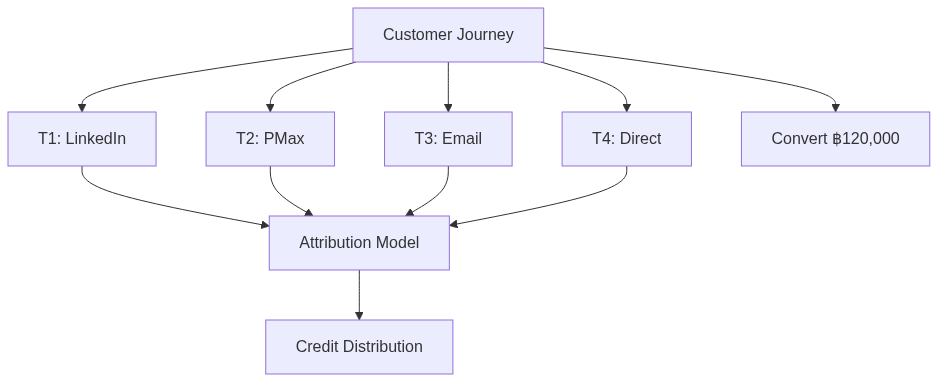
ตัวอย่าง customer journey:
Day 1: LinkedIn post (brand)
Day 3: Google search "best CRM thailand" → Click PMax ad
Day 7: Email newsletter → Click link
Day 14: Direct visit → Book demo
Day 45: Close ฿120,000
มี 4 touchpoint — ใครได้ credit ของ ฿120,000?
นี่คือสิ่งที่ attribution model ตอบ
ทำไม Attribution Model สำคัญ
- Budget allocation — ลด/เพิ่ม budget channel ไหน
- Channel ROI evaluation — channel ไหน “ลึก ๆ” ได้ผล
- Sales-marketing alignment — สรุปได้ว่า marketing contribute เท่าไหร่
- Optimization decision — ทำอะไรเพิ่มถึงเร่ง revenue
7 Attribution Models — เปรียบเทียบ
1. First-Touch Attribution
Rule: 100% credit → touchpoint แรก
ตัวอย่าง: LinkedIn (Day 1) ได้ ฿120,000 — touchpoint อื่นได้ ฿0
ดีตรงไหน:
– เน้นความสำคัญของ awareness channel
– ช่วยตัดสินใจลงทุน top-of-funnel
ปัญหา:
– Ignore touchpoint หลังจากนั้น
– ทำให้ over-invest awareness, under-invest conversion
Use when:
– Pure brand campaign — วัด awareness contribution
– New product launch — focus discovery
2. Last-Click Attribution (Last-touch)
Rule: 100% credit → touchpoint สุดท้ายก่อน conversion
ตัวอย่าง: Direct (Day 14) ได้ ฿120,000
ดีตรงไหน:
– ตรงไปตรงมา + เข้าใจง่าย
– เหมาะกับ short journey (e-commerce ราคาต่ำ)
ปัญหา:
– Ignore ทุก touchpoint ก่อนหน้า
– Direct/Organic มัก over-credit (เพราะคนรู้จัก brand แล้ว)
– ทำให้ paid channel ดู under-perform เสมอ
Use when:
– E-commerce ราคาต่ำ + impulse buy
– Sanity check baseline
3. Last Non-Direct Click
Rule: 100% credit → last click ที่ไม่ใช่ direct
ตัวอย่าง: Email (Day 7) ได้ ฿120,000 (เพราะ Direct ที่ Day 14 ถูก skip)
ดีตรงไหน:
– Fix ปัญหาที่ Direct over-credit
– Default ของ GA Universal Analytics (ตอนนี้ deprecated)
ปัญหา:
– Still ignore touchpoint แรก ๆ
– Email/Last marketing channel ได้ credit เกินจริง
Use when:
– Legacy GA migration period
– Compare กับ GA UA historical data
4. Linear Attribution
Rule: Credit แบ่งเท่าๆ กันทุก touchpoint
ตัวอย่าง: 4 touchpoint แต่ละตัวได้ ฿30,000 (120,000 ÷ 4)
ดีตรงไหน:
– ยุติธรรมที่สุด — ทุก touchpoint สำคัญ
– เริ่มเข้าใจ multi-touch contribution
ปัญหา:
– Treat ทุก touchpoint เท่ากัน — ในความจริง บาง touch มี impact มากกว่า
– Optimization signal ไม่ชัด
Use when:
– เริ่มต้น multi-touch attribution
– B2B ที่ touchpoint จำนวนใกล้เคียงกันทุก deal
5. Time-Decay Attribution
Rule: Touchpoint ใกล้ conversion ได้ credit มากกว่า (exponential decay)
ตัวอย่าง:
– LinkedIn (Day 1, 44 days before close): ฿9,000 (7.5%)
– PMax (Day 3, 42 days): ฿12,000 (10%)
– Email (Day 7, 38 days): ฿18,000 (15%)
– Direct (Day 14, 31 days): ฿24,000 (20%)
– หลัง direct น่ามี touchpoint อื่นอีกที่ใกล้ close → จะได้ credit เพิ่ม
ดีตรงไหน:
– Reflect business reality — touchpoint ใกล้ปิด deal สำคัญกว่า
– Default ของ Google Ads conversion model สมัยใหม่
ปัญหา:
– ยัง under-credit top-of-funnel
– Half-life parameter ต้อง tune
Use when:
– B2B ที่ sales cycle ยาว — late touchpoint = sales-led
– Default ที่ดีถ้าไม่มี Data-driven
6. U-shaped (Position-Based) Attribution
Rule: First-touch ได้ 40%, Last-touch ได้ 40%, middle ทั้งหมดได้ 20%
ตัวอย่าง:
– LinkedIn (first): ฿48,000 (40%)
– PMax (middle): ฿12,000 (10%)
– Email (middle): ฿12,000 (10%)
– Direct (last): ฿48,000 (40%)
ดีตรงไหน:
– Balance discovery + closing
– Acknowledge ความสำคัญของ first + last
ปัญหา:
– Middle ได้ credit น้อยเกินไป
– Arbitrary 40-20-40 split
Use when:
– B2B ที่ discovery + closing สำคัญพอกัน
– เน้น brand-driven + conversion-driven equally
7. Data-Driven Attribution (DDA)
Rule: Machine learning algorithm คำนวณ credit ตามผลกระทบจริงของแต่ละ touchpoint
ตัวอย่าง (algorithm output):
– LinkedIn: ฿24,000 (20%)
– PMax: ฿42,000 (35%)
– Email: ฿18,000 (15%)
– Direct: ฿36,000 (30%)
ดีตรงไหน:
– ใช้ data จริงไม่ใช่ rule
– Update อัตโนมัติเมื่อ behavior เปลี่ยน
– GA4 default + Google Ads default
ปัญหา:
– ต้องมี volume พอ (≥ 300 conversion/30 day)
– Black-box — ไม่อธิบาย “ทำไม”
– Cross-domain tracking ต้อง setup ดี
Use when:
– B2B ที่มี volume พอ — choice #1
– มี GA4 + Conversion API setup ครบ
8. (Bonus) Markov Chain Attribution
Rule: ใช้ probabilistic model คำนวณ “removal effect” — ถ้าตัด touchpoint นี้ออก probability ของ conversion ลดเท่าไหร่
ดีตรงไหน:
– Mathematically rigorous
– ใช้ในงาน research / advanced MMM
ปัญหา:
– ต้องการ data scientist
– Tool น้อย (R, Python custom)
Use when:
– Mature B2B with internal data team
– Need rigorous causal inference
Comparison Table
| Model | First touch | Middle | Last touch | Complexity | Volume need |
|---|---|---|---|---|---|
| First-touch | 100% | 0% | 0% | ⭐ | Low |
| Last-click | 0% | 0% | 100% | ⭐ | Low |
| Last non-direct | 0% | 0%* | 100%* | ⭐ | Low |
| Linear | Equal | Equal | Equal | ⭐⭐ | Low |
| Time-decay | Low | Mid | High | ⭐⭐⭐ | Medium |
| U-shaped | 40% | 20%total | 40% | ⭐⭐⭐ | Low |
| Data-driven | Algorithm | Algorithm | Algorithm | ⭐⭐⭐⭐ | ≥ 300/mo |
| Markov chain | Algorithm | Algorithm | Algorithm | ⭐⭐⭐⭐⭐ | ≥ 1,000/mo |
* skipping Direct
ตัวอย่างจริง — Apply 7 Models กับ B2B Journey
Customer journey:
– Day 1: LinkedIn post engagement
– Day 5: Google Search → Click brand ad
– Day 12: Webinar registration → Attend
– Day 18: Email newsletter → Click case study
– Day 25: LinkedIn ad → Click retargeting
– Day 30: Direct visit → Book demo
– Day 60: Close ฿200,000
Credit Distribution:
| Touchpoint | First-touch | Last-click | Linear | Time-decay | U-shaped | Data-driven (estimate) |
|---|---|---|---|---|---|---|
| LinkedIn organic | ฿200,000 | ฿0 | ฿33,333 | ฿10,000 | ฿80,000 | ฿20,000 |
| Google brand ad | ฿0 | ฿0 | ฿33,333 | ฿15,000 | ฿8,000 | ฿30,000 |
| Webinar | ฿0 | ฿0 | ฿33,333 | ฿22,000 | ฿8,000 | ฿60,000 |
| ฿0 | ฿0 | ฿33,333 | ฿30,000 | ฿8,000 | ฿20,000 | |
| LinkedIn ad | ฿0 | ฿0 | ฿33,333 | ฿40,000 | ฿8,000 | ฿30,000 |
| Direct | ฿0 | ฿200,000 | ฿33,333 | ฿83,000 | ฿80,000 | ฿40,000 |
Insight: เลือก model ต่างกัน → conclusion ต่างกัน 100% — webinar อาจดู “no contribution” (First-touch/Last-click) หรือ “biggest driver” (Data-driven) — ทั้งที่ journey เดียวกัน
เลือก Model ไหนสำหรับ B2B ไทย — Decision Framework
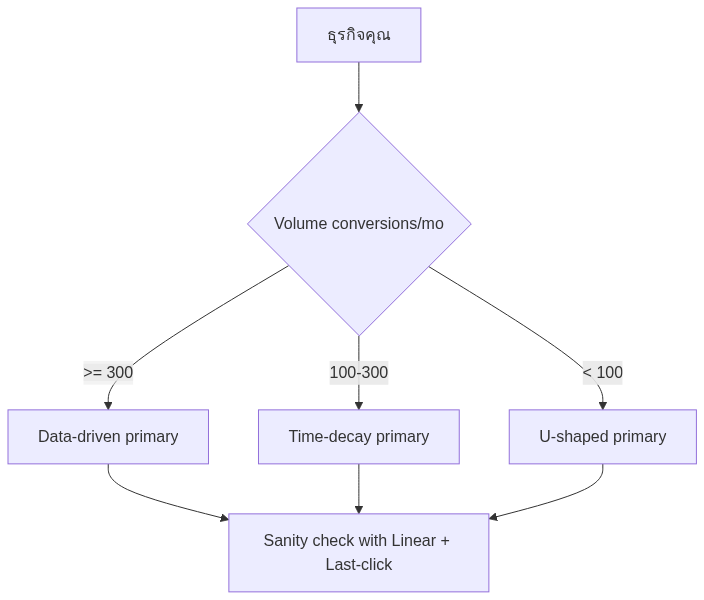
Tiered Recommendation
| Stage | Primary Model | Sanity Check Model |
|---|---|---|
| Start-up (< 50 conv/mo) | U-shaped | First-touch + Last-click |
| Growth (50-300 conv/mo) | Time-decay | Linear + Last-click |
| Scale (> 300 conv/mo) | Data-driven (GA4) | Time-decay + Last-click |
| Enterprise | Data-driven + MMM | Markov chain |
Why “Primary + Sanity Check”
ใช้ 2 model พร้อมกัน:
– Primary — ใช้ตัดสินใจ budget allocation
– Sanity check — เปรียบเทียบเพื่อ catch anomaly
ถ้า Data-driven บอก “LinkedIn = top channel” แต่ Last-click = “Direct = top” — investigate ว่าเกิดอะไร
Tools — Implement Attribution Model
| Tool | Models Supported | Best for |
|---|---|---|
| GA4 | Data-driven, Cross-channel last-click, First-click, Linear, Position-based, Time-decay | Default for most |
| Google Ads | Data-driven (default), Last-click, First-click, Linear, Time-decay, Position-based | Google Ads only |
| HubSpot | Last interaction, First interaction, Linear, U-shape, W-shape, Time-decay | Marketing-Sales journey |
| Salesforce Pardot | Even Distribution, First Touch, Last Touch, U-shaped, W-shaped | Salesforce ecosystem |
| Triple Whale / Northbeam | Data-driven + Custom | E-commerce / D2C |
| Custom (BigQuery + Python) | Any | Advanced + data team |
Common Mistakes ของ Attribution ใน B2B ไทย
1. ใช้ Last-click ตลอด
- ที่ B2C ก็ work ไม่ดี — B2B ยิ่งแย่ (long journey)
- ทางออก: ใช้ Data-driven หรือ Time-decay
2. Compare ROAS ข้าม Model
- “Meta ROAS 3x” (Last-click) vs “Google ROAS 5x” (Data-driven) = compare ไม่ได้
- ทางออก: ใช้ model เดียวกันทุก channel
3. Cross-domain ไม่ Setup
- LinkedIn → click → ไป intermediate page → form on different subdomain = session reset
- ทางออก: GA4 cross-domain config + UTM consistent
4. ไม่มี Server-side Tracking
- iOS + ad blocker → client-side tracking miss 20-40% data
- ทางออก: setup CAPI (Meta), Enhanced Conversion (Google), server-side GTM
5. ตัดสินใจจาก Single Channel Report
- Meta Ads report ของ Meta = self-reported (biased)
- ทางออก: ใช้ neutral source (GA4) เป็น single source of truth
6. ไม่ Update Model เมื่อ Business เปลี่ยน
- 1 ปีก่อนเป็น B2B SMB now กลายเป็น mid-market = journey ยาวขึ้น
- ทางออก: review attribution model ทุก 6 เดือน
ภาพรวม Attribution → Action
attribution model ตัวเลข บอกสิ่งที่เกิดขึ้น — แต่ action ต่อ ขึ้นกับ context:
| Insight | Action |
|---|---|
| Top channel = LinkedIn (Data-driven) | เพิ่ม LinkedIn budget + organic effort |
| Channel A high spend, low credit | Cut budget, redirect to better channel |
| Webinar = highest credit per touchpoint | สร้าง webinar 2x/เดือน |
| Direct = 30% of credit | Brand work paying off — keep investing |
| Email very effective when ใกล้ close | Add late-stage email sequence |
Action Plan — Setup Attribution ใน 30 วัน
Week 1: Foundation
– Audit current GA4 setup
– Enable Data-driven attribution (default)
– Setup Conversion API ทุก channel หลัก
– Cross-domain tracking config
Week 2: Sanity Check Framework
– เลือก 2 secondary model (Last-click + Time-decay)
– Build dashboard ที่แสดง 3 model parallel
– Set baseline 30-day comparison
Week 3: Internal Alignment
– Brief stakeholder (CEO, sales, finance)
– Agree on “primary model for decision”
– Document การ interpret model
Week 4: Optimize
– Identify under-credited channel ใน last-click → over-funded ที่ Data-driven
– Reallocate 10-20% budget เป็น test
– Set review cadence (monthly)
สรุป
attribution model คือ rules ที่ตัดสินใจว่าใครได้ credit ของ conversion — เลือกผิด = decision ผิดต่อเนื่อง
หลักการสำคัญ:
– No model perfect — เลือกที่ฟิตกับ business stage + volume
– Data-driven = first choice ถ้ามี volume
– Time-decay หรือ U-shaped = good default
– Last-click = sanity check ไม่ใช่ primary
– Multi-model view — ใช้ 2-3 model parallel
– Setup foundation ก่อน — GA4 + CAPI + cross-domain
อ่านต่อ:
– Attribution Model B2B Guide (Pillar) — ภาพรวม attribution + MMM
– MarTech Analytics & Tracking Guide — GA4 + GTM + CAPI setup
– ROAS / CPA / CPL Calculator — metric สำหรับ judge attribution result
– Marketing Framework B2B Guide — framework รวม attribution decision
ถ้าอยากให้ทีม Adsitec ช่วย setup multi-model attribution dashboard สำหรับ B2B ของคุณ — นัดคุย 30 นาที